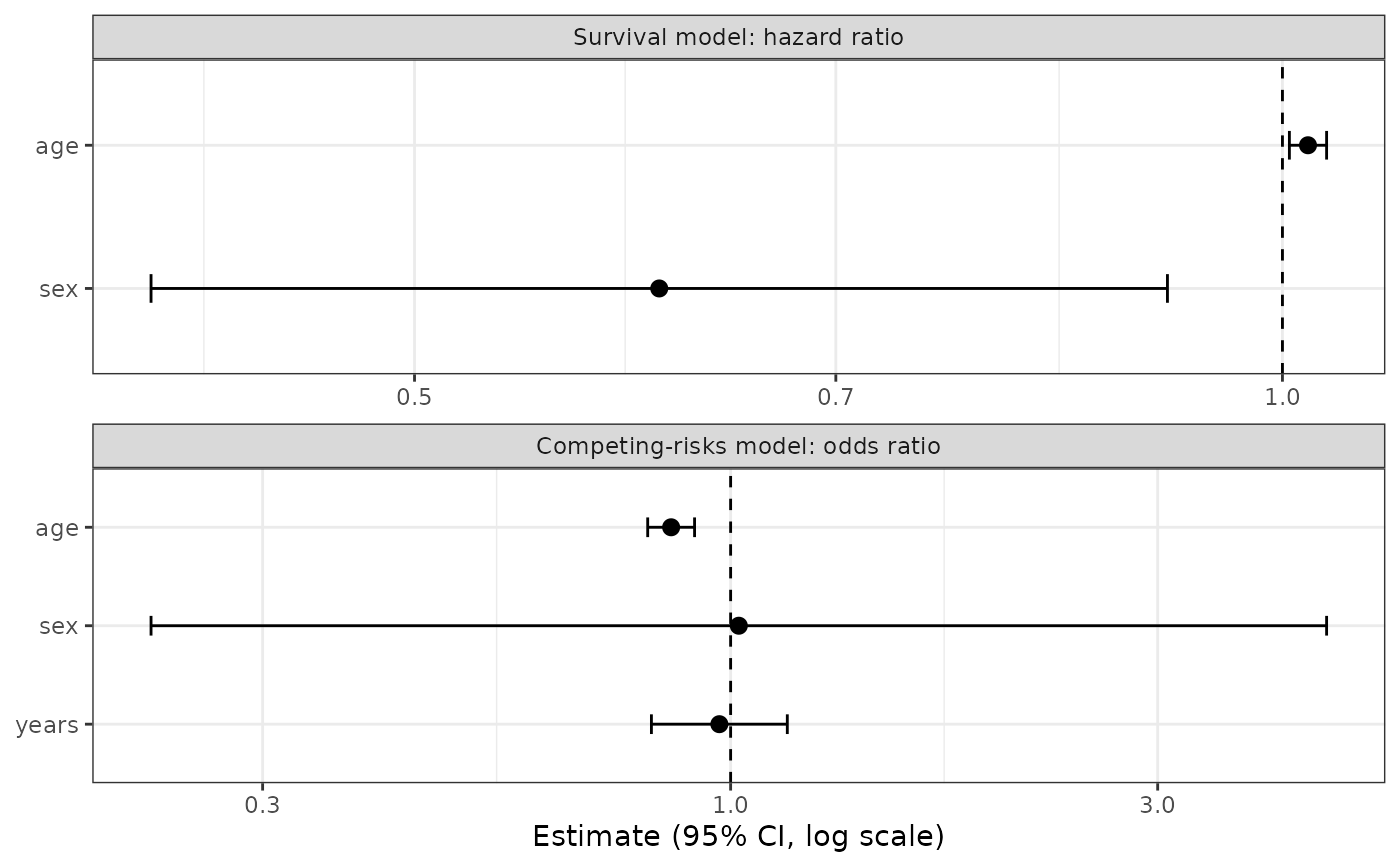
"forest"Forest plot of the hazard ratios (with 95\ confidence intervals) of the Cox marginal survival model and, when the fit has competing risks, of the odds ratios (with 95\ intervals) of the logistic event-type model, on a log scale with a reference line at 1.
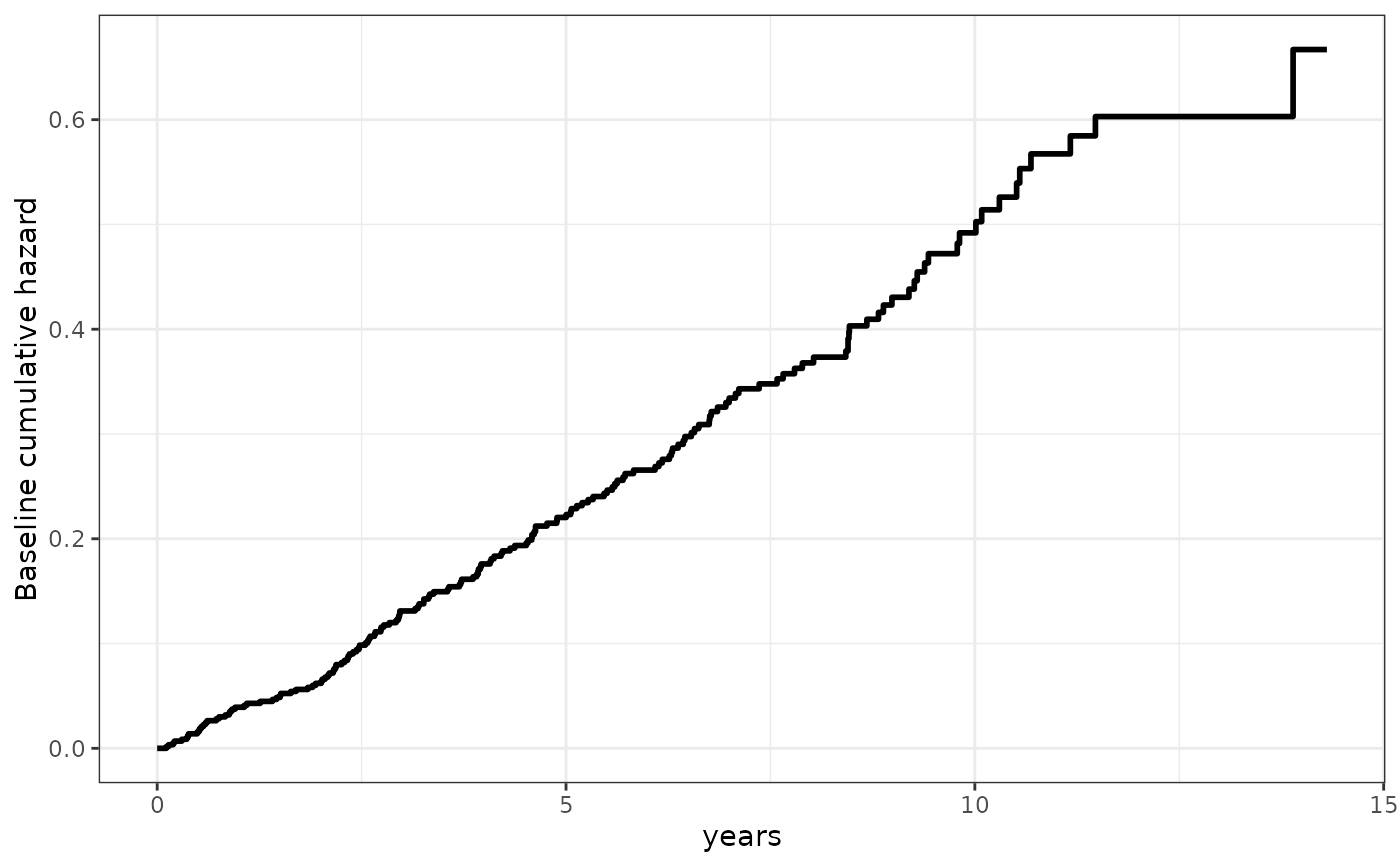
"basehaz"The Cox model's baseline cumulative hazard (covariates at 0, not centered), one step curve per stratum.
Arguments
- x
A
survivalSub.BJMobject returned bysurvivalSub.- which
Which plot to draw:
"forest"(default) or"basehaz".- ...
Currently unused.
Examples
data(pbc3)
data_survival_fitting <- pbc3[!duplicated(pbc3$id), ]
survival_fit_all <- survivalSub(data_survival_fitting,
Surv(years, status3) ~ age + sex,
status4 ~ years + age + sex)
plot(survival_fit_all)
 plot(survival_fit_all, which = "basehaz")